e-H scattering
In this tutorial, we will show how to model the problem of an electron wavepacket scattering on an hydrogen atom using Octopus. In order to speed up the calculations and make it easier to plot the different quantities of interest, we will do the calculation in 1D. It should be straightforward to change this example to simulate a “real” 3D hydrogen atom.
Ground state
The first thing to do is to tell Octopus what we want it to do. We will start with an input file containing only the description of a 1D hydrogen atom, modeled by a soft Coulomb potential:
FromScratch = yes
CalculationMode = gs

Dimensions = 1

Radius = 50
Spacing = 0.15

%Species
 "H" | species_soft_coulomb | softening | 1 | valence | 1
%

%Coordinates
 "H" | -10
%

SpinComponents = polarized

ExtraStates = 1

%Occupations
 1 | 0
 0 | 0
%
These input variables should already be familiar as they have been explained in previous tutorials. Here we simply note the following:
- Spacing: We employed a large box. This is needed for the time-dependent simulation, and, as we will see, is in fact not large enough for correctly describing our e-H problem for even 1 fs.
- ExtraStates: We requested one extra state. This is not really needed for the ground-state calculation, but is crucial for the time-dependent run bellow, as there we will replace this unoccupied state by the electron wavepacket.
- Occupations: We have fixed the occupations to be one in the first spin channel. This is needed for the TD run, as we will see, and also because otherwise the code might get to a different ground state than the one we are interested.
Output
Now one can execute this file by running Octopus. Here are a few things worthy of a closer look in the standard output. We are doing an LDA calculation, as we want to investigate the role of electron-electron interaction here, and, as a possible application, benchmark the performance of exchange-correlation functionals. As we are doing a one dimensional calculation, we see that Octopus has selected the corresponding 1D version of the LDA functional:
**************************** Theory Level ****************************
Input: [TheoryLevel = kohn_sham]

Exchange-correlation:
  Exchange
    Exchange in 1D (LDA)
    [1] N. Helbig, J. I. Fuks, M. Casula, M. J. Verstraete, M. A. L. Marques, I. V. Tokatly, and A. Rubio, Phys. Rev. A 83, 0325
  Correlation
    Casula, Sorella & Senatore (LDA)
    [1] M. Casula, S. Sorella, and G. Senatore, Phys. Rev. B 74, 245427 (2006)

Input: [SICCorrection = sic_none]
**********************************************************************
e-H scattering
We are now ready to perform a simulation of the e-H scattering problem. For this, we use the following input file:
FromScratch = yes
CalculationMode = td

Dimensions = 1

Radius = 50
Spacing = 0.15

%Species
"H" | species_soft_coulomb | softening | 1 | valence | 1
%

%Coordinates
"H" | -10
%

SpinComponents = polarized

ExtraStates = 1

ExcessCharge = -1
%Occupations
 1 | 1
 0 | 0
%
RestartFixedOccupations = no

a = 0.1
x0 = 10.0
p = -1.5
%UserDefinedStates
  1 | 2 | 1 | formula | "exp(-a*(x-x0)^2+i*p*(x-x0))"
%

%Output
 density
 potential
%
OutputFormat = axis_x

TDPropagationTime = 0.8 * femtosecond
In order to introduce the electron wavepacket to scatter on the hydrogen atom, we have done the following change:
- ExcessCharge: We introduce an extra electron in our simulation by setting this variable to -1.
- Occupations: We force the extra electron to be on the second state of the first spin channel.
- RestartFixedOccupations = no: Note, that we need to override the default behaviour to keep the occupations from the restart file.
- UserDefinedStates: We are replacing the originally unoccupied state obtained after the GS calculation by a user defined state, which is a Gaussian of the form $ \phi(x) = e^{-\alpha (x-x_0)^2+i p (x-x_0)}, $ where $\alpha$ is taken to be $\alpha=0.1$ here, $x_0$ is the initial position of the wavepacket, taken to be at $x_0=-10$ a.u., and $p$ its velocity, taken to be $p=-1.5$ a.u..
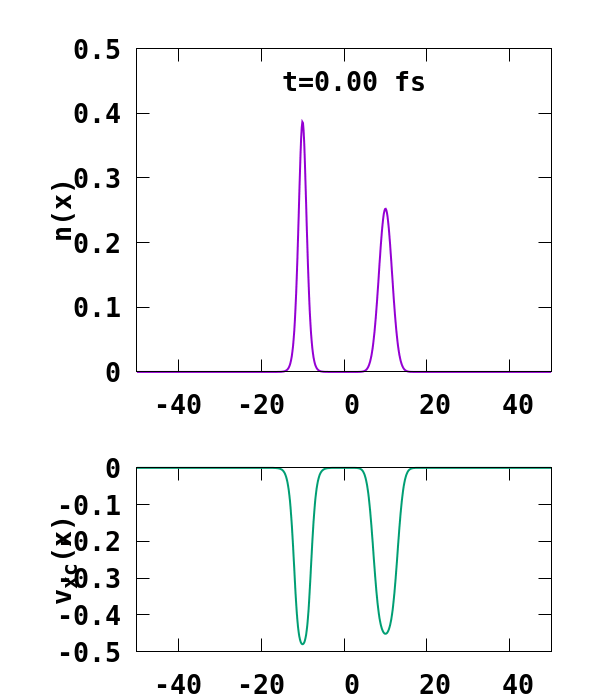
The result of the calculation is shown in Fig. 1. What we are interested in is the density of the up channel, where both electrons are, as well as the corresponding potential. These quantities are found in the file ‘output_iter/td.XXXXXXX/density-sp1.y=0,z=0’ and ‘output_iter/td.XXXXXXX/vxc-sp1.y=0,z=0’. We note a few interesting details. First, we observe no significant reflection of the wavepacket density on the hydrogen atom. This is a known deficiency of the adiabatic approximation. Moreover, towards the end of the simulation, both the density and the exchange-correlation potential show strong oscillations on the left-hand side of the simulation. This is due to the artificial reflection of the electron wavepacket at the border of the simulation box. This can be easily fixed by double the size of the box (Radius = 100), and/or by using absorbing boundaries.
Gnuplot script
In order to produce the above movie, one can use the following gnuplot script
set terminal pngcairo font "Monospace-Bold,20" size 600,700

do for [t=0:1112:50] {

 set output sprintf('potential_%04i.png',t)

 set multiplot

 set xrange [-50:50]

 set tmargin 1.5
 set bmargin 1.5

 set size 1.0, 0.6
 set origin 0.0, 0.4
 set ylabel "n(x)" offset 2.0,0

 au2fs = 0.024189
 dt = 0.02973;

 set label sprintf('t=%.2f fs', t*dt*au2fs) at -15,0.45
 set yrange [0:0.5]
 plot sprintf('output_iter/td.%07i/density-sp1.y=0,z=0', t) u 1:2 w l lw 2 notitle

 unset label
 set size 1.0, 0.4
 set origin 0.0, 0.0
 set yrange [-0.5:0.0]
 set ylabel "v_{xc}(x)" offset 2.0,0
 set xlabel "x [Bohr]" offset 0, 0.6
 plot sprintf('output_iter/td.%07i/vxc-sp1.y=0,z=0', t) u 1:2 w l ls 2 lw 2 notitle

 unset label
 unset multiplot
}
and convert it to a movie using convert
convert -delay 20 -loop 0 potential_*.png scattering.gif