Tutorial Profiling nsight
In this tutorial, we want to profile the GPU version of octopus using NVIDIA Nsight Systems. This allows us to see which parts are executed on the GPU and which parts might still be executed on the CPU or where transfers lead to inefficiencies.
Prerequisites
Compiling octopus
Make sure that octopus has been compiled with CUDA and NVTX support. For this, you need to add
the options --enable-cuda --enable-nvtx at the configure step. Then, it should be listed in
the Configuration options section of the Octopus standard output. For example:
Configuration options : maxdim3 openmp mpi cuda sse2 avx
If you compile the parallel MPI version, the configure script will automatically detect if CUDA-aware MPI is supported (works for OpenMPI). For the beginning, you don’t necessarily need this feature, but it is very important for obtaining the best performances in the case domain-parallel runs.
Please refer to the Octopus installation guide for detailed compilation instructions.
Nsight systems has only built-in support for tracing the OpenMPI and MPICH implementations of MPI. If you are using a different MPI implementation, you can use NVTX PMPI wrappers for profiling.
Nsight systems
We use NVIDIA Nsight Systems for the profiling which is a low overhead performance analysis tool, designed to analyze program on GPUs. To collect the profiling data, you need to have Nsight Systems CLI installed on your target machine. Please refer to the NVIDIA Nsight Systems installation guide for more details. If you want to run Nsight Systems inside a container, please refer to this guide. Many of the NVIDIA GPU Cloud catalog already include the Nsight Systems.
Nsight systems is available on MPCDF systems as a module and can be loaded as:
module load nsight_systems/2021
In order to analyze the results, you need to use the Nsight systems GUI. For this, you have several options:
- Run the GUI on the remote machine (e.g. login node of the cluster) using X forwarding (i.e.
ssh -XC login_node). This can be laggy due to the connection. - Run the GUI locally; for this you need to install Nsight systems on your laptop (see https://docs.nvidia.com/nsight-systems/InstallationGuide/index.html)
- If you can use MPCDF services, you can use the remote visualization service to get an X session with access to your files (https://rvs.mpcdf.mpg.de/)
Run the profiling
Use the following input file
  CalculationMode = gs
  FromScratch = yes

  XYZCoordinates = "1ala.xyz"

  Radius = 4.0*angstrom
  Spacing = 0.4*angstrom
  Eigensolver = rmmdiis

  ProfilingMode = prof_time
together with the file 1ala.xyz :
 23
 units: A
      N                   -1.801560    0.333315   -1.308298
      C                   -1.692266    1.069227    0.012602
      C                   -0.217974    1.151372    0.425809
      O                    0.256888    2.203152    0.823267
      C                   -2.459655    0.319513    1.077471
      H                   -1.269452    0.827043   -2.046396
      H                   -1.440148   -0.634968   -1.234255
      H                   -2.791116    0.267637   -1.602373
      H                   -2.104621    2.114111   -0.129280
      H                   -2.391340    0.844513    2.046396
      H                   -2.090378   -0.708889    1.234538
      H                   -3.530691    0.246022    0.830204
      N                    0.476130   -0.012872    0.356408
      C                    1.893957   -0.046600    0.735408
      C                    2.681281    0.990593   -0.107455
      O                    3.486946    1.702127    0.516523
      O                    2.498931    1.021922   -1.333241
      C                    2.474208   -1.425485    0.459844
      H                    0.072921   -0.880981    0.005916
      H                    1.975132    0.211691    1.824463
      H                    1.936591   -2.203152    1.019733
      H                    3.530691   -1.461320    0.761975
      H                    2.422706   -1.683153   -0.610313
It is important that you enable the time profiling in your Octopus input file
using ProfilingMode= prof_time. This is required for activating the
NVTX markers and ranges.
Now you can run octopus with the profiler as follows:
nsys profile -t cuda,nvtx,mpi octopus
This will run octopus on one core. To use it on several cores (and potentially also on several GPUs), you can use:
nsys profile -t cuda,nvtx,mpi srun -n 2 octopus
This will run octopus with 2 MPI ranks using srun (use this inside a slurm script). You might need to adapt this to your MPI launcher (e.g. mpiexec) and number of MPI tasks.
Octopus will run as usual and at the end of the run a report file with .qdrep
extension will be generated. If you run nsys more often, it will create files
with increasing numbers to avoid overwriting old results.
By default, the Nsight systems will use /tmp/nvidia to store temporary files
during data collection. In case you are running the profiler on a disk-less
machine (such as MPCDF’s Raven cluster) you must set the TMPDIR environment
variable in your job submission script to another fast storage device instead.
For example: export TMPDIR=/ptmp/$USER/nvidia
Analyze the results
Inspect the generated report file. The best way of inspecting the report file
is using the Nsight Systems GUI (nsys-ui) which is included in the
Nsight Systems installation. As explained above, you can start it locally or remotely on
the cluster you ran the simulation on.
After running the nsys-ui, open the report file
and you will see the timeline view of the report.
You can expand the rows for NVTX to see the annotation of the code ranges.
This is very useful because it shows you a timeline with all profiling
regions of the code which is very instructive.
Here is an example screenshot:
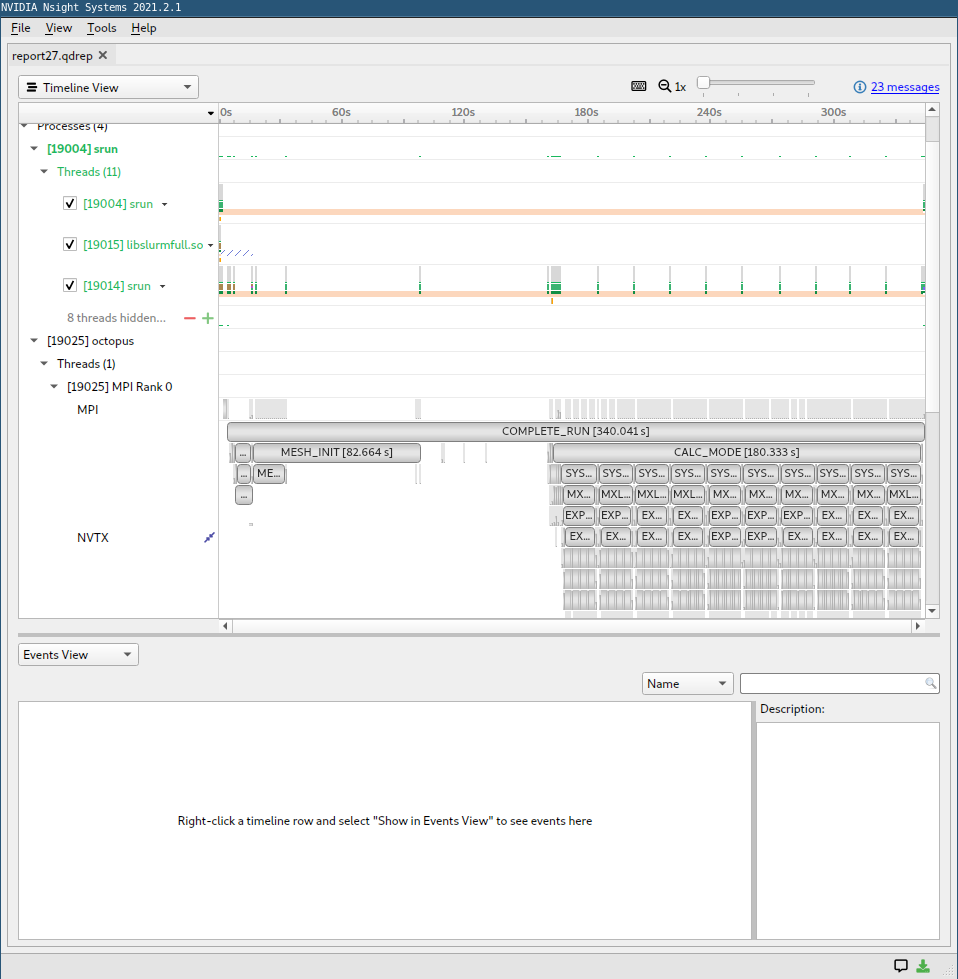
In the row “memory”, you can see the transfers from and to the GPU with some details about their speed. In the row “kernels”, you see which kernels run on the GPU and also some details about their launching parameters. It is a good sign if you see that kernels are continuously running on the GPU with minimum data transfers. If either no kernel is running or there are a lot of data transfers, it is usually a sign of bad performance. Then you can look at the NVTX regions where no kernels are running on the GPU to find out which parts are not yet ported. Note that the names of the different regions correspond to the profiling regions of the internal Octopus profiling tool.
Check out the Nsight Systems documentation for detailed information on using the Nsight Systems GUI.
Next steps
Now, profile and analyze a TD run which is usually more efficient on GPUs. For this, use the following input file:
  CalculationMode = td
  FromScratch = yes

  XYZCoordinates = "1ala.xyz"

  Radius = 4.0*angstrom
  Spacing = 0.4*angstrom

  ProfilingMode = prof_time

  TDPropagator = aetrs
  TDMaxSteps = 20
  TDTimeStep = 0.05
and run octopus again with Nsight systems to get a profile that you can analyze in the GUI.
Slurm script for Raven
To run octopus on the MPCDF system Raven, you can use the following slurm script which will use one node with 4 GPUs:
#!/bin/bash -l
# Standard output and error:
#SBATCH -o ./log.%j
#SBATCH -D ./
#SBATCH -J octopus
#SBATCH --constraint="gpu"
#SBATCH --nodes=1
#SBATCH --ntasks-per-node=4
#SBATCH --cpus-per-task=18
#SBATCH --gres=gpu:a100:4
#SBATCH --time=00:30:00

# For pinning threads correctly:
export OMP_PLACES=cores
export OMP_NUM_THREADS=$SLURM_CPUS_PER_TASK

module purge
module load octopus-gpu/main
srun octopus

# to run with nsight, comment out the "srun octpus" line above and uncomment the following lines
#module load nsight_systems/2021
#export TMPDIR=/ptmp/$USER/nvidia
#mkdir -p $TMPDIR
#nsys profile -t cuda,nvtx,mpi srun octopus
To run only on one GPU, you can use:
#!/bin/bash -l
# Standard output and error:
#SBATCH -o ./log.%j
#SBATCH -D ./
#SBATCH -J octopus
#SBATCH --constraint="gpu"
#SBATCH --ntasks=1
#SBATCH --cpus-per-task=18
#SBATCH --gres=gpu:a100:1
#SBATCH --mem=125000
#SBATCH --time=00:30:00

# For pinning threads correctly:
export OMP_PLACES=cores
export OMP_NUM_THREADS=$SLURM_CPUS_PER_TASK

module purge
module load octopus-gpu/main
srun octopus

# to run with nsight, comment out the "srun octpus" line above and uncomment the following lines
#module load nsight_systems/2021
#export TMPDIR=/ptmp/$USER/nvidia
#mkdir -p $TMPDIR
#nsys profile -t cuda,nvtx,mpi srun octopus