Kronig-Penney Model
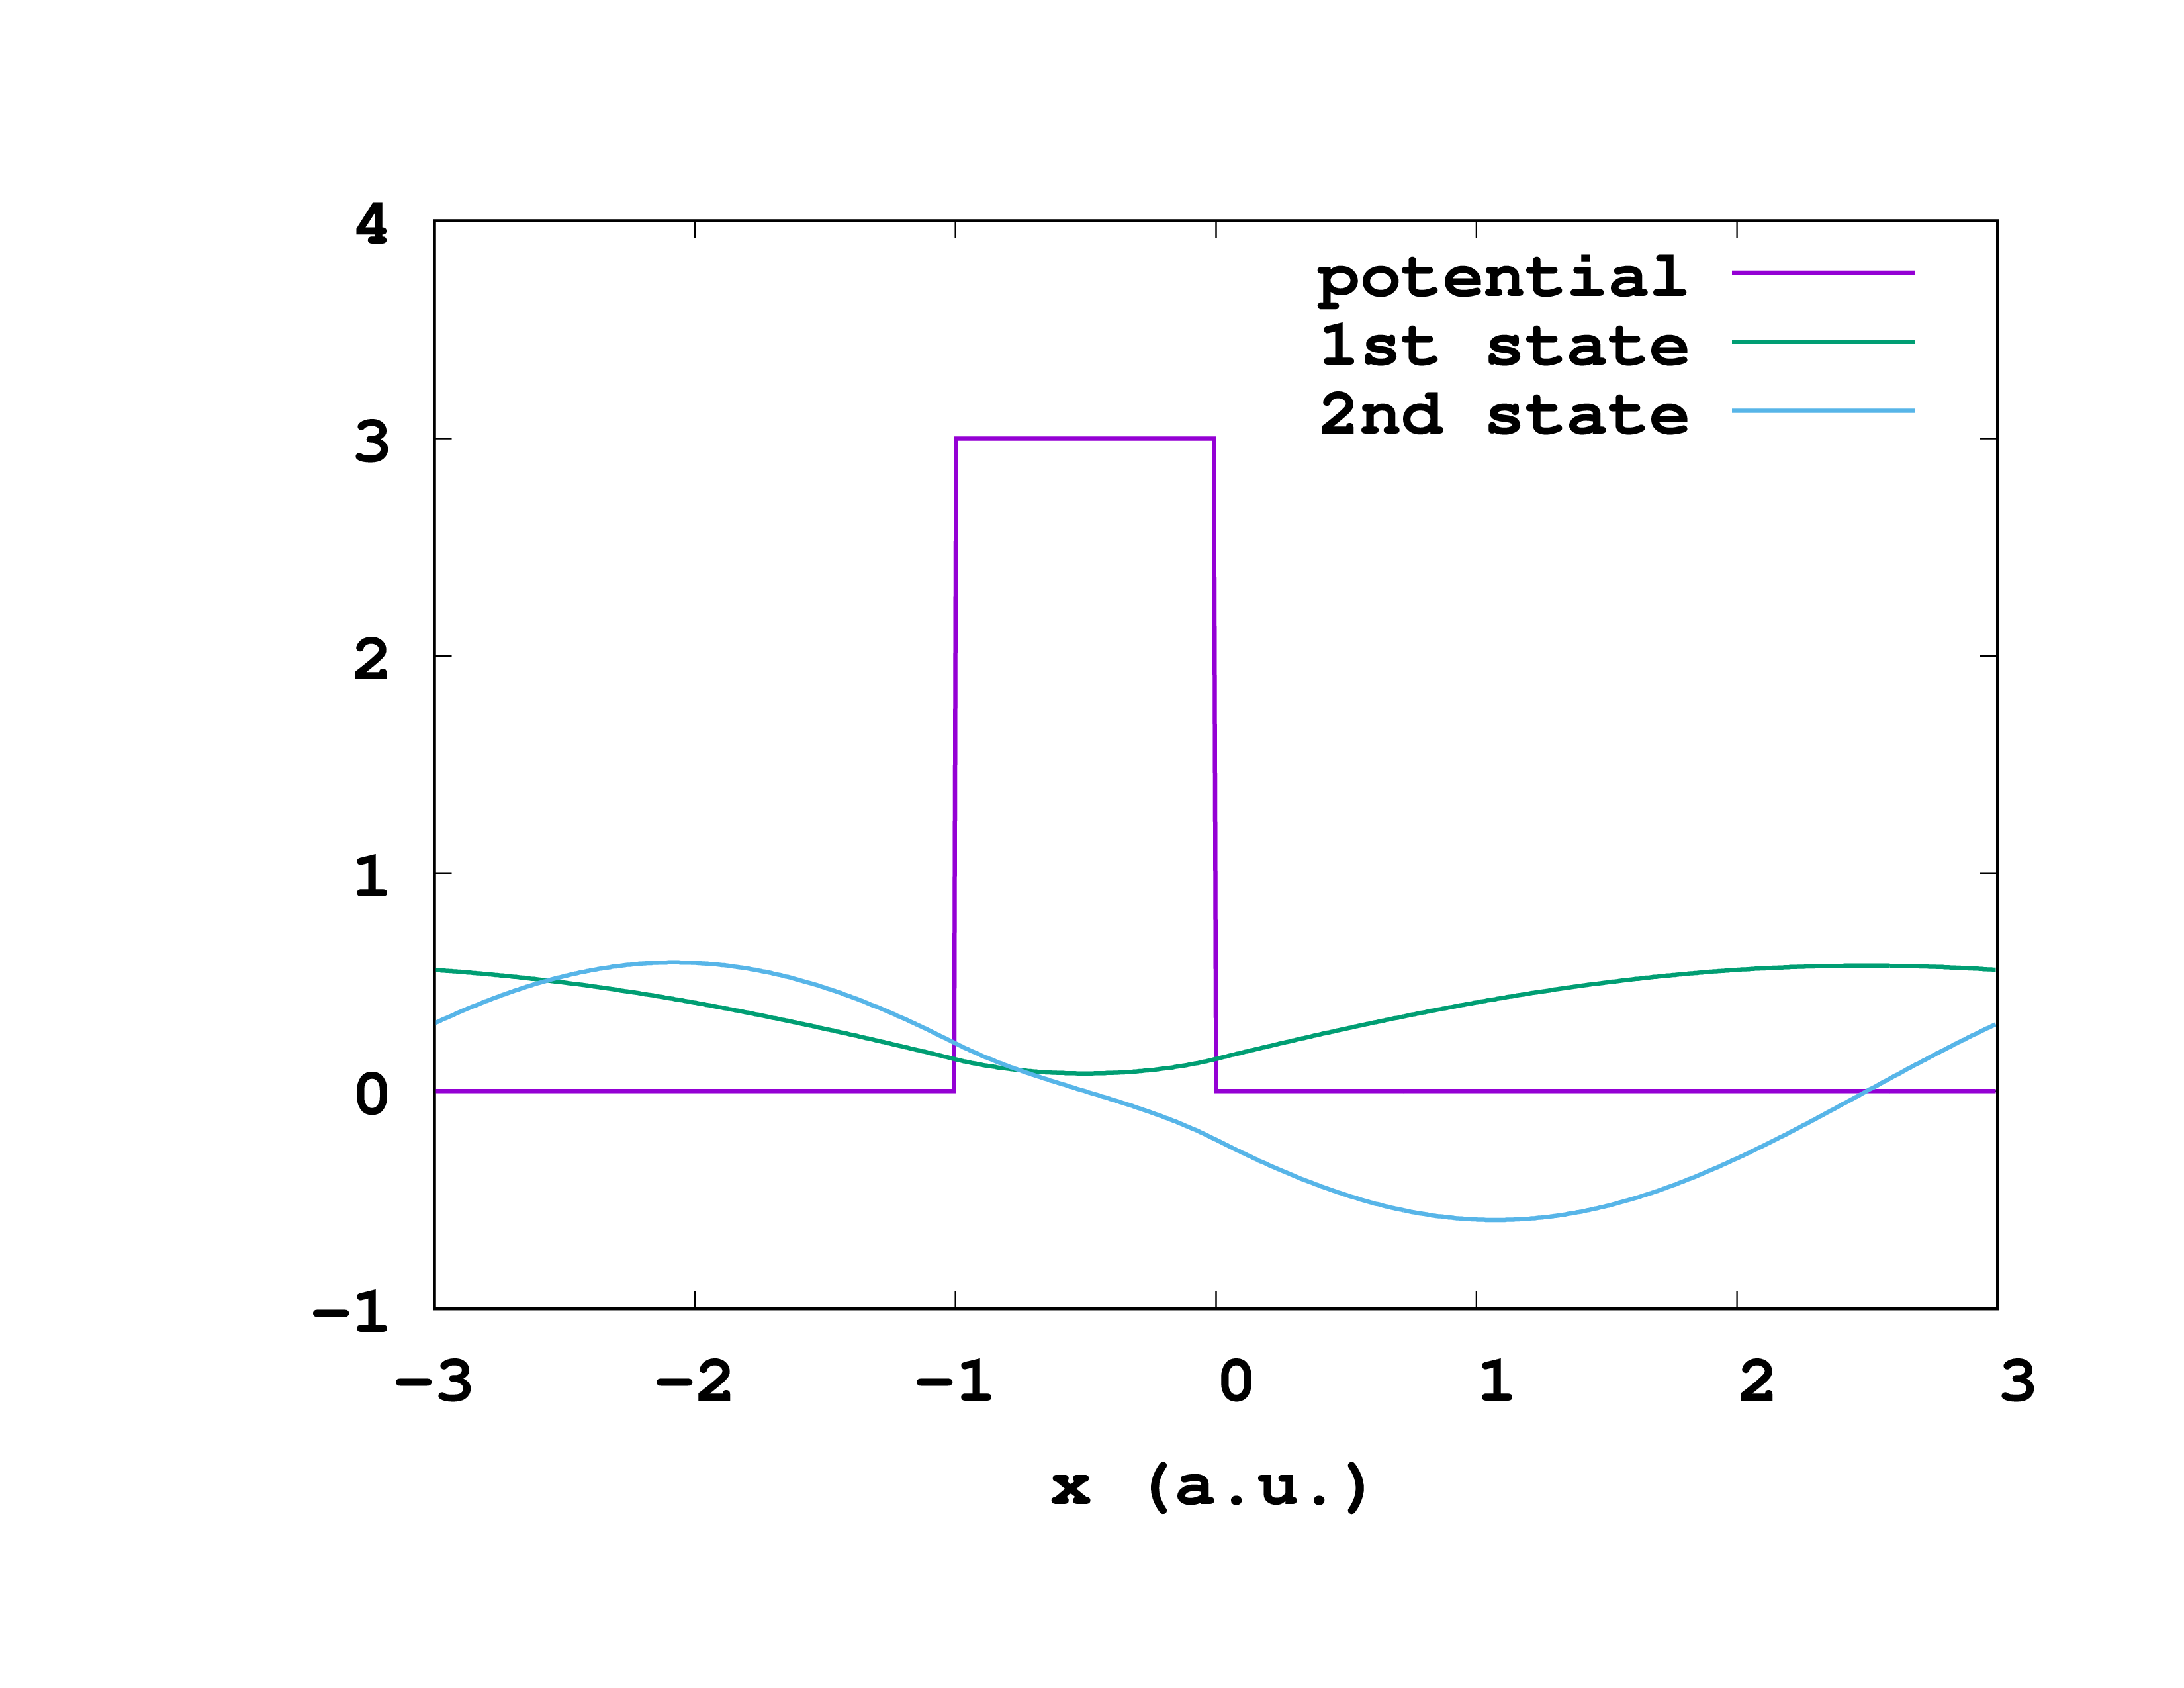
The Kronig-Penney model is a 1D system that demonstrates band gaps, which relate to the allowed energies for electrons in a material. In this tutorial we calculate the bandstructure for Kronig-Penney Model. The Kronig-Penney Model has a periodic potential of
$$ V(x) = \begin{cases} V_0 & -b < x < 0 \cr 0 & 0 < x < a \end{cases} $$
Where b is the width of each barrier, and a is the spacing between them.
Input
The following input file will be used for the ground state calculation:
CalculationMode = gs
ExtraStates = 4
PeriodicDimensions = 1
Dimensions = 1
TheoryLevel = independent_particles

a = 5
b = 1
V = 3

Lsize = (a + b)/2

%LatticeParameters
  a + b
%

Spacing = .0075

%Species
 "A" | species_user_defined | potential_formula | "(x>-b)*V*(x<0)" | valence | 1
%

%Coordinates
 "A" | 0 |
%

%KPointsGrid
 11 |
%

%KPointsPath
  11 |
 0.0 |
 0.5 |
%

ConvEigenError = true

%Output
 potential
 wfs
%
OutputFormat = axis_x
OutputWfsNumber = "1,2"
Bandstructure
To calculate the bandstructure simply change the CalculationMode to unocc.
 CalculationMode = unocc
 ExtraStates = 4
 PeriodicDimensions = 1
 Dimensions = 1
 TheoryLevel = independent_particles

 a = 5
 b = 1
 V = 3

 Lsize = (a + b)/2

 %LatticeParameters
   a + b
 %

 Spacing = .0075

 %Species
  "A" | species_user_defined | potential_formula | "(x>-b)*V*(x<0)" | valence | 1
 %

 %Coordinates
  "A" | 0 |
 %

 %KPointsGrid
  11 |
 %

 %KPointsPath
  11 |
 0.0 |
 0.5 |
 %

 ConvEigenError = true
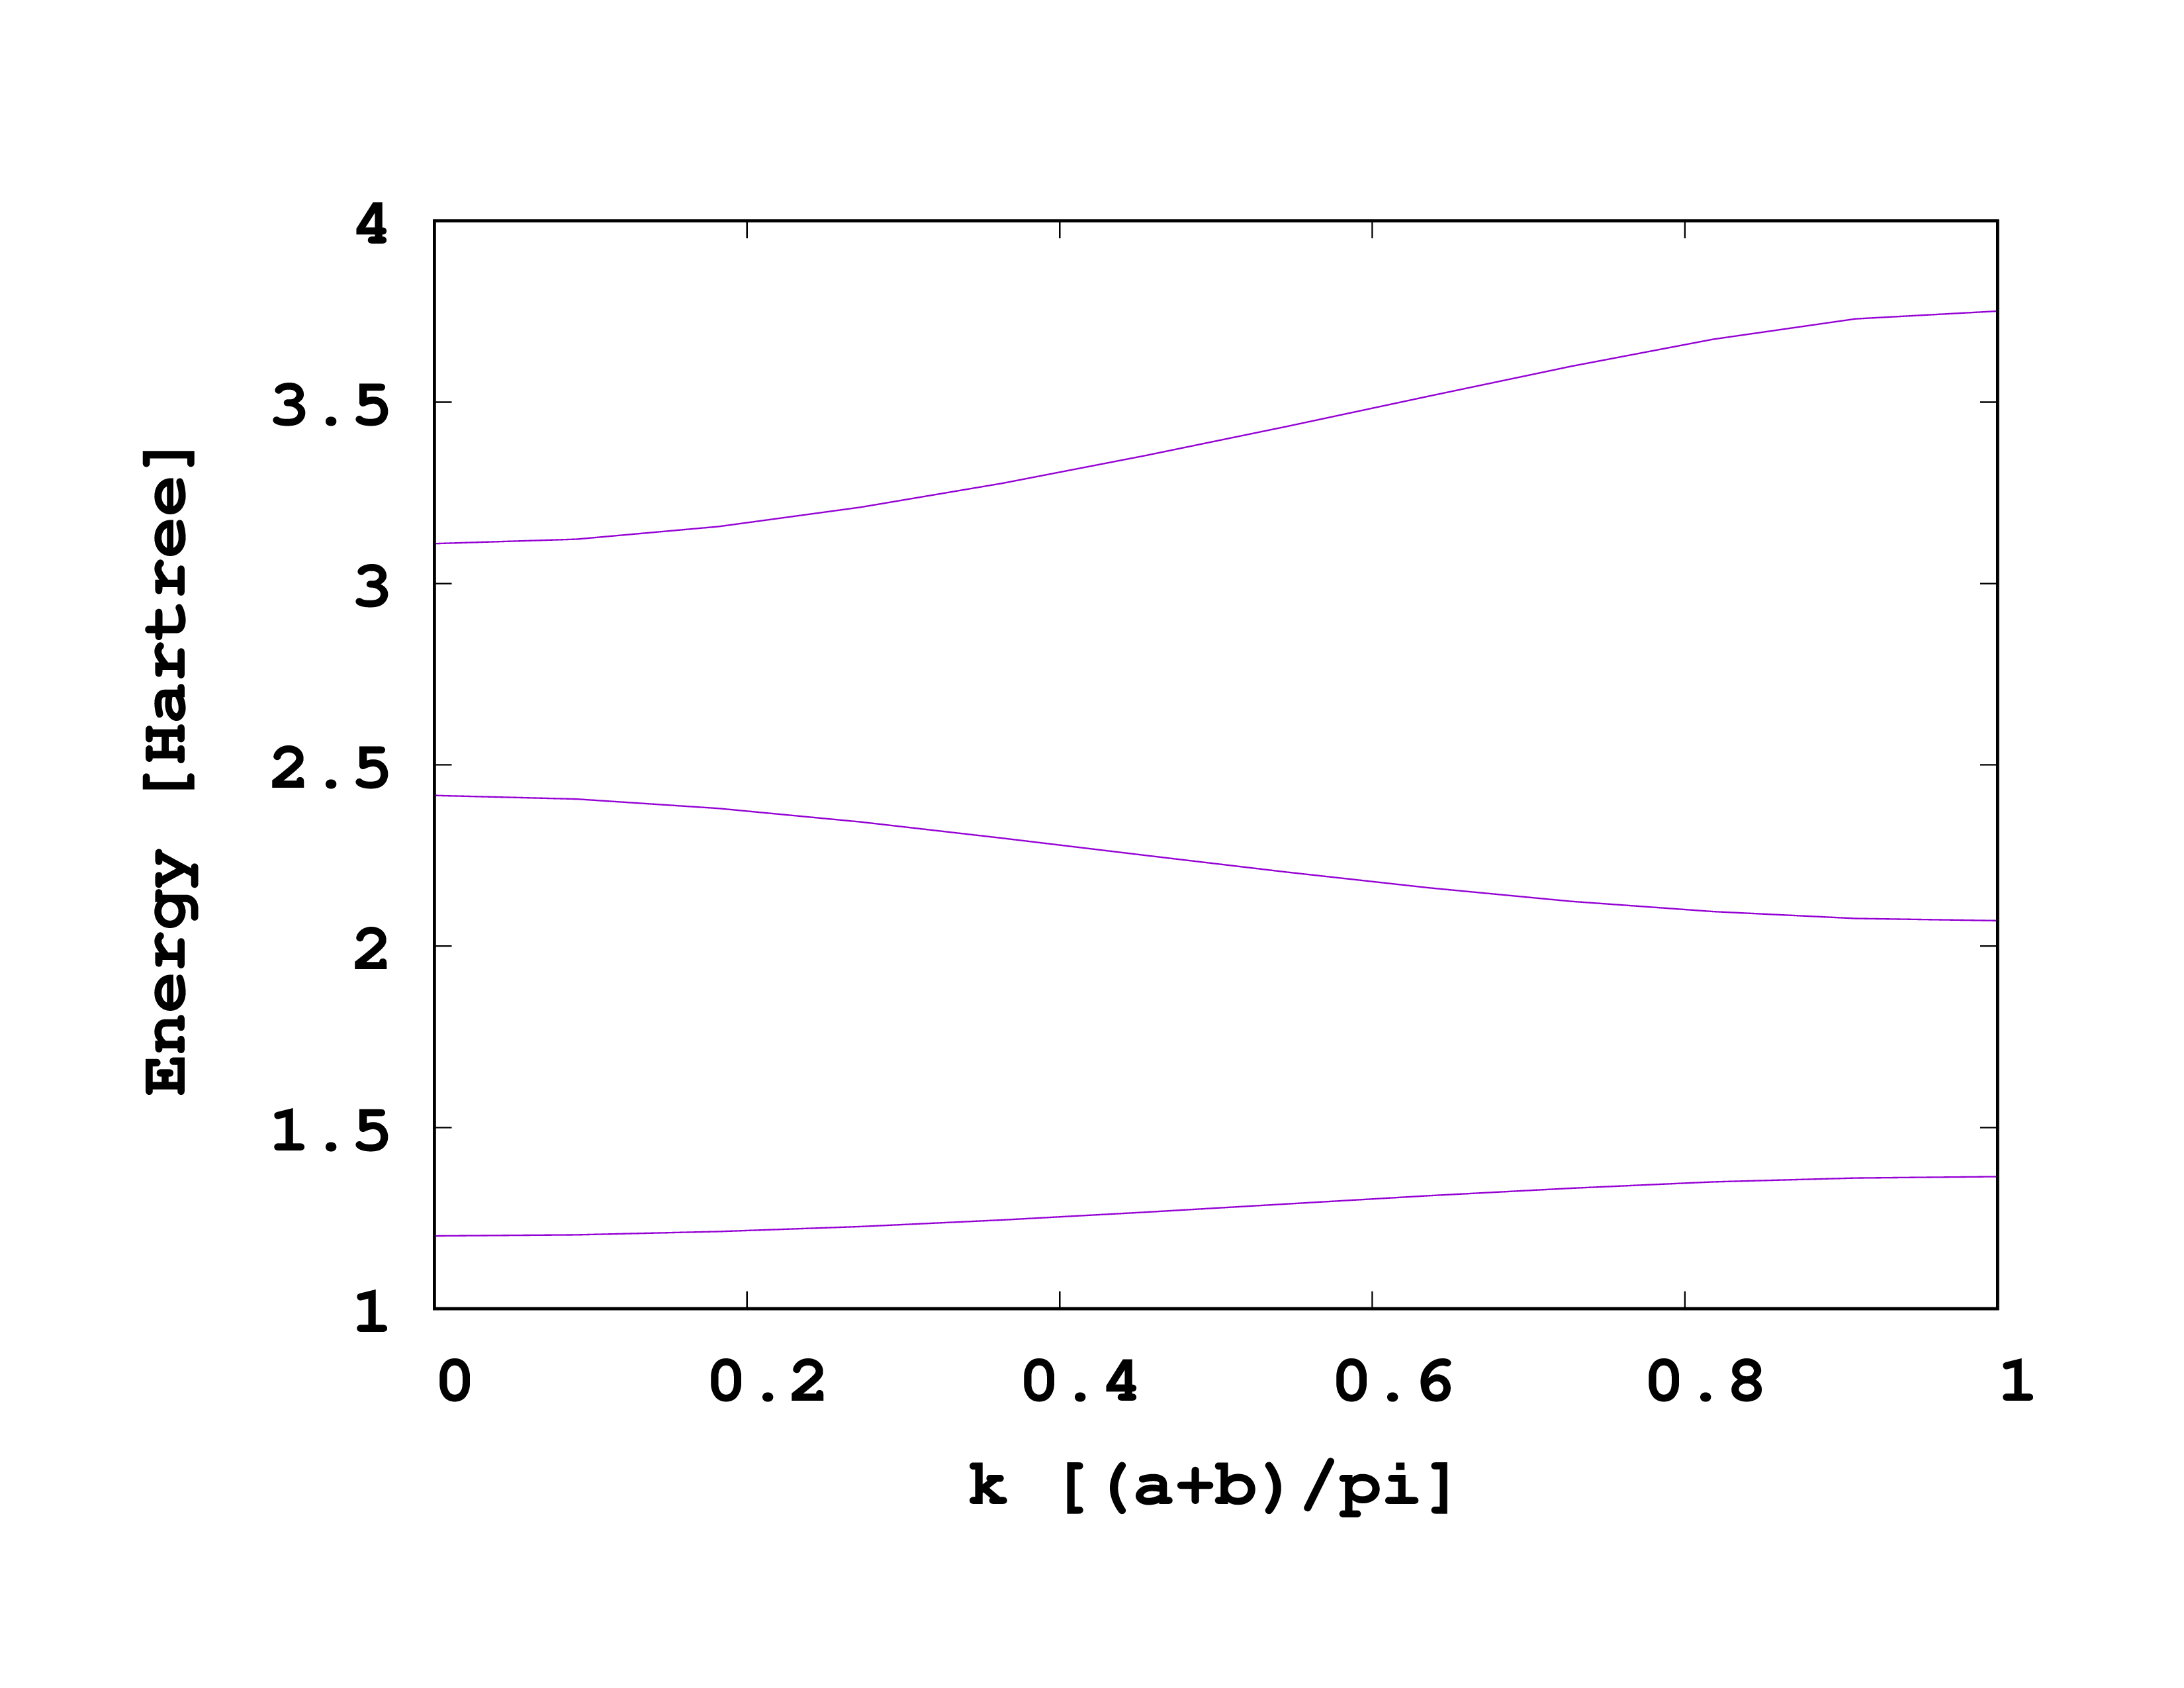
To plot the bandstructure, we will use the same command from the Periodic Systems (assuming you are using gnuplot).
set xlabel "k [(a+b)/pi]"
set ylabel "Energy [Hartree]"
set t postscript enhanced color font "Monospace-Bold,25" landscape size 11,8.5
set output "bandstructure.eps"
set key top left

set rmargin 4.5
set lmargin 10.5
set tmargin 3.2
set bmargin 5.5

plot for [col=5:5+9] 'static/bandstructure' u 1:(column(col)) w l notitle ls 1
Reference:
Sidebottom DL. Fundamentals of condensed matter and crystalline physics: an introduction for students of physics and materials science. New York: Cambridge University Press; 2012.